MapEquation MapEquation

Papers describing the map equation framework and corresponding Infomap algorithms

Presentations

Tutorials

Research papers


2026

Community Detection with the Map Equation and Infomap: Theory and Applications

Jelena Smiljanić, Christopher Blöcker, Anton Holmgren, Daniel Edler, Magnus Neuman, Martin Rosvall

ACM Computing Surveys 58(7), 1-34 (2026) [pdf] [arXiv:2311.04036]

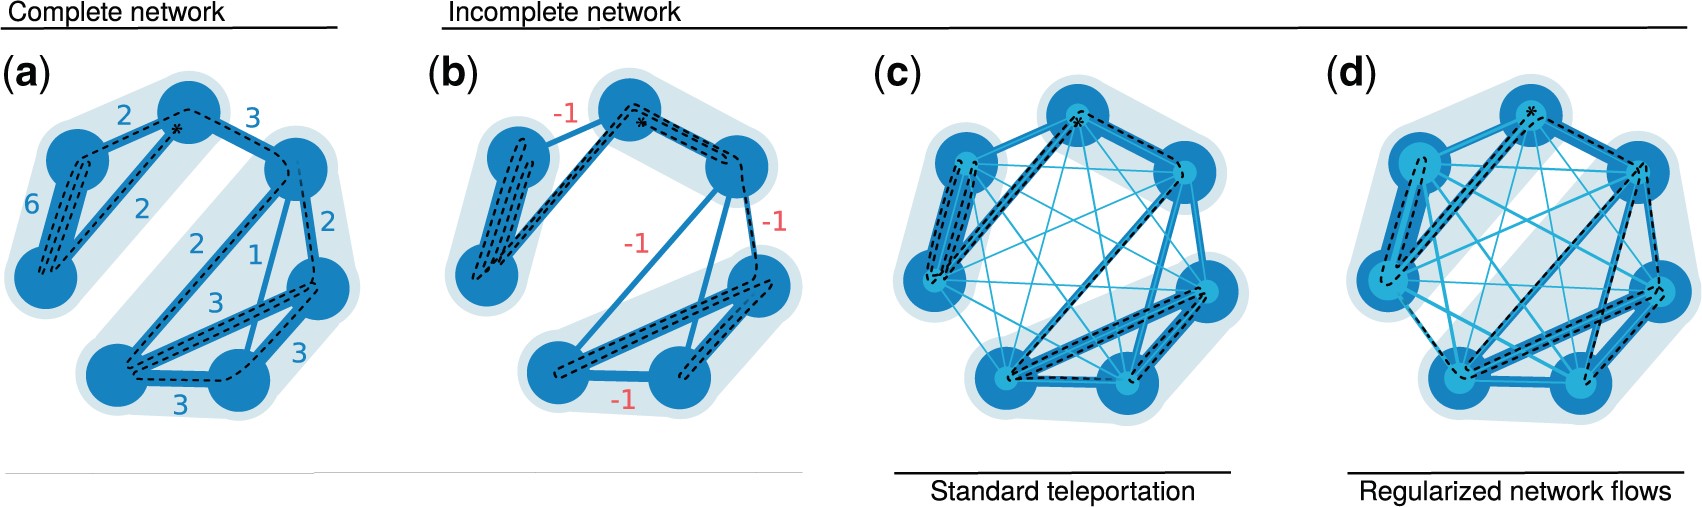
Real-world networks have a complex topology comprising many elements often structured into communities. Revealing these communities helps researchers uncover the organizational and functional structure of the system that the network represents. However, detecting community structures in complex networks requires selecting a community detection method among a multitude of alternatives with different network representations, community interpretations, and underlying mechanisms. This tutorial focuses on a popular community detection method called the map equation and its search algorithm Infomap. The map equation framework for community detection describes communities by analyzing dynamic processes on the network. Thanks to its flexibility, the map equation provides extensions that can incorporate various assumptions about network structure and dynamics. To help decide if the map equation is a suitable community detection method for a given complex system and problem at hand — and which variant to choose — we review the map equation’s theoretical framework and guide users in applying the map equation to various research problems.
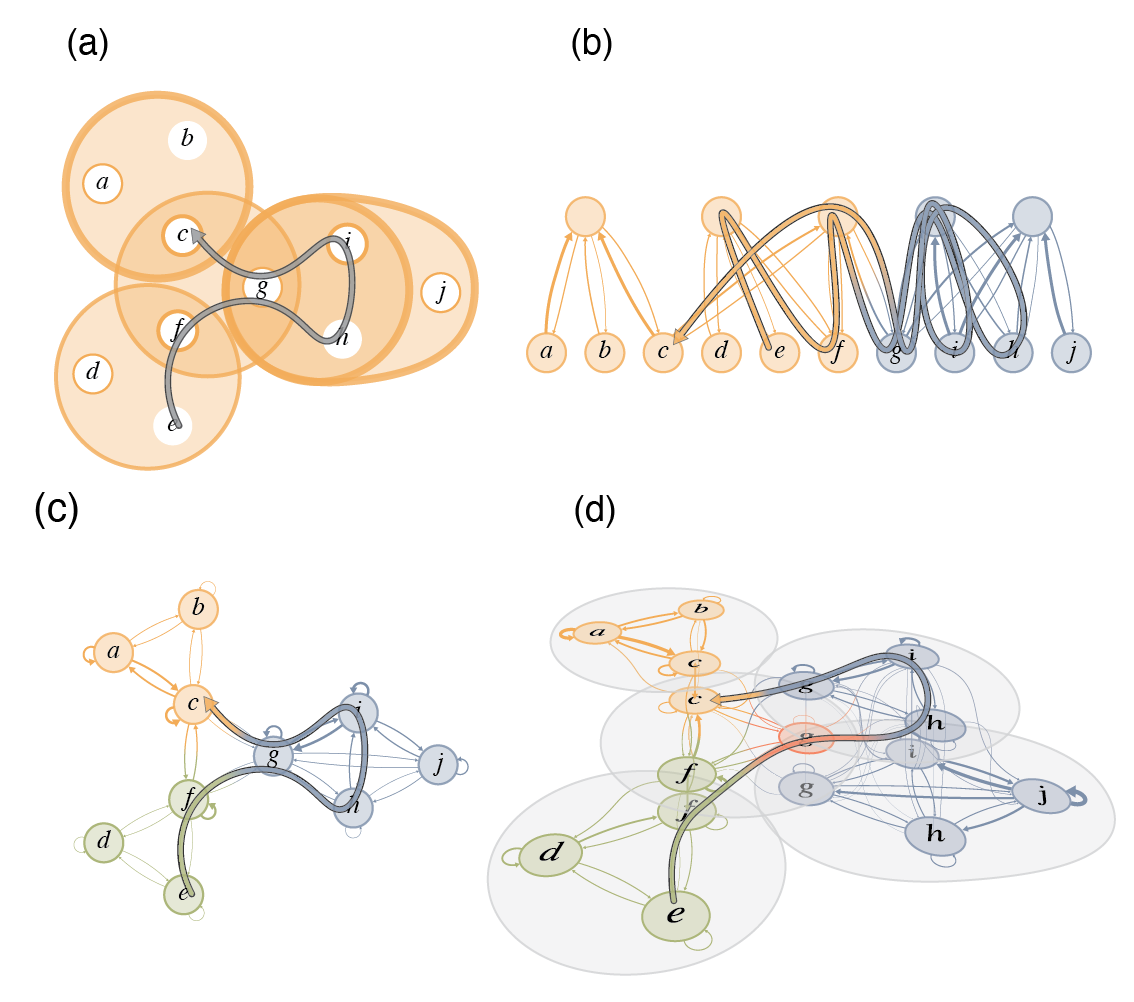
Modeling and mapping flow with the map equation framework. Given complex system data, the researcher first selects an appropriate network representation (left column) based on the type of interactions. Pairwise interactions can be represented with weighted and directed networks, where link strength and direction capture interaction frequency and orientation. Multi-mode interactions call for multilayer networks, where nodes are replicated across layers representing different times, contexts, or modes. Multi-step interactions are captured with memory networks, where physical nodes (large circles) are associated with state nodes (smaller circles) that retain information about interaction sequences. Multi-body interactions among more than two nodes are naturally represented by hypergraphs, where hyperedges connect multiple nodes simultaneously. Next, a random walk model approximates real-world flow (middle column). Finally, minimizing the map equation reveals flow modules where a random walker remains for extended periods (right column). Because network flows reflect the systems' function, flow modules reveal the systems' functional components.

Mapping memory-biased dynamics with compact models reveals overlapping communities in large networks

Maja Lindström, Rohit Sahasrabuddhe, Anton Holmgren, Christopher Blöcker, Daniel Edler, Martin Rosvall

Journal of Physics: Complexity (2026) [pdf] [arXiv:2304.05775]

Many real-world systems, from social networks to protein-protein interactions and species distributions, exhibit overlapping flow-based communities that reflect their functional organisation. However, reliably identifying such overlapping flow-based communities requires higher-order relational data, which are often unavailable. To address this challenge, we capitalise on the flow model underpinning the representation-learning algorithm node2vec and model higher-order flows through memory-biased random walks on first-order networks. Instead of simulating these walks, we model their higher-order dynamic constraints with compact models and control model complexity with an information-theoretic approach. Using the map equation framework, we identify overlapping modules in the resulting higher-order networks. Our compact-model approach proves robust across synthetic benchmark networks, reveals interpretable overlapping communities in empirical networks, and scales to large networks.

A compact representation of higher-order dynamics reveals overlapping communities. (a) A first-order network constrains a memoryless random walk that supports two non-overlapping communities. (b) We introduce a second-order model by biasing transitions: arriving along the link (i, j), the random walker at node j is biased to backtrack by a factor 1/p and to move to a node not adjacent to i by a factor 1/q. (c) We describe the bias in each physical node with state nodes, where arrows indicate transition probabilities. (d) To manage computational complexity, we lump state nodes within each physical node. (e) By connecting the lumped state nodes, we construct a compact network representation. (f) Mapping the memory-biased random walk on the compact network reveals overlapping communities in the middle node.

2025

Reliable data clustering with Bayesian community detection

Magnus Neuman, Jelena Smiljanić, Martin Rosvall

arXiv:2510.15013 (2025) [pdf] [arXiv:2510.15013]

From neuroscience and genomics to systems biology and ecology, researchers rely on clustering similarity data to uncover modular structure. Yet widely used clustering methods, such as hierarchical clustering, k-means, and WGCNA, lack principled model selection, leaving them susceptible to noise. A common workaround sparsifies a correlation matrix representation to remove noise before clustering, but this extra step introduces arbitrary thresholds that can distort the structure and lead to unreliable results. To detect reliable clusters, we capitalize on recent advances in network science to unite sparsification and clustering with principled model selection. We test two Bayesian community detection methods, the Degree-Corrected Stochastic Block Model and the Regularized Map Equation, both grounded in the Minimum Description Length principle for model selection. In synthetic data, they outperform traditional approaches, detecting planted clusters under high-noise conditions and with fewer samples. Compared to WGCNA on gene co-expression data, the Regularized Map Equation identifies more robust and functionally coherent gene modules. Our results establish Bayesian community detection as a principled and noise-resistant framework for uncovering modular structure in high-dimensional data across fields.

Compressing regularized dynamics improves link prediction with the map equation in sparse networks

Maja Lindström, Christopher Blöcker, Tommy Löfstedt, Martin Rosvall

Physical Review E 111, 044309 (2025) [pdf] [arXiv:2410.08777]

Predicting future interactions or novel links in networks is an indispensable tool across diverse domains, including genetic research, online social networks, and recommendation systems. Among the numerous techniques developed for link prediction, those leveraging the networks’ community structure have proven highly effective. For example, the recently proposed MapSim predicts links based on a similarity measure derived from the code structure of the map equation, a community-detection objective function that operates on network flows. However, the standard map equation assumes complete observations and typically identifies many small modules in networks where the nodes connect through only a few links. This aspect can degrade MapSim’s performance on sparse networks. To overcome this limitation, we propose to incorporate a global regularization method based on a Bayesian estimate of the transition rates along with three local regularization methods. The regularized versions of the map equation compensate for incomplete observations and mitigate spurious community fragmentation in sparse networks. The regularized methods outperform standard MapSim and several state-of-the-art embedding methods in highly sparse networks. The principled global method requires no hyperparameter tuning and runs at least an order of magnitude faster than the embedding methods.

2024

Module-based regularization improves Gaussian graphical models when observing noisy data

Magnus Neuman, Joaquín Calatayud, Viktor Tasselius, Martin Rosvall

Applied Network Science 9, 8 (2024) [pdf] [arXiv:2303.16796]

Inferring relations from correlational data allows researchers across the sciences to uncover complex connections between variables for insights into the underlying mechanisms. The researchers often represent inferred relations using Gaussian graphical models, requiring regularization to sparsify the models. Acknowledging that the modular structure of the inferred network is often studied, we suggest module-based regularization to balance under- and overfitting. Compared with the graphical lasso, a standard approach using the Gaussian log-likelihood for estimating the regularization strength, this approach better recovers and infers modular structure in noisy synthetic and real data. The module-based regularization technique improves the usefulness of Gaussian graphical models in the many applications where they are employed.

2023

Mapping change in higher-order networks with multilevel and overlapping communities

Anton Holmgren, Daniel Edler, Martin Rosvall

Applied Network Science 8, 42 (2023) [pdf] [arXiv:2303.00622]

New network models of complex systems use layers, state nodes, or hyperedges to capture higher-order interactions and dynamics. Simplifying how the higher-order networks change over time or depending on the network model would be easy with alluvial diagrams, which visualize community splits and merges between networks. However, alluvial diagrams were developed for networks with regular nodes assigned to non-overlapping flat communities. How should they be defined for nodes in layers, state nodes, or hyperedges? How can they depict multilevel, overlapping communities? Here we generalize alluvial diagrams to map change in higher-order networks and provide an interactive tool for anyone to generate alluvial diagrams. We use the alluvial generator to illustrate the effect of modeling network flows with memory in a citation network, distinguishing multidisciplinary from field-specific journals.

Multilevel organization of science, 2001–2007. The journals organize into five large research areas, further divided into research fields. We show the top-level organization of earth sciences, economics, and computer science (the three small modules at the top). We show the finer division into research fields for the physical and life sciences. We sort the fields or areas by their citation flow and show the top-ranking journal in each research field or area. Finally, we highlight the insignificant assignment of journals clustered with Ecology in 2001 to a significantly distinct research field since 2003. At the top level shown in the inset, the same journals cluster significantly with the life sciences since 2007.

Compressing network populations with modal networks reveals structural diversity

Alec Kirkley, Alexis Rojas, Martin Rosvall, Jean-Gabriel Young

Communications Physics 6, 148 (2023) [pdf] [arXiv:2209.13827]

Analyzing relational data consisting of multiple samples or layers involves critical challenges: How many networks are required to capture the variety of structures in the data? And what are the structures of these representative networks? We describe efficient nonparametric methods derived from the minimum description length principle to construct the network representations automatically. The methods input a population of networks or a multilayer network measured on a fixed set of nodes and output a small set of representative networks together with an assignment of each network sample or layer to one of the representative networks. We identify the representative networks and assign network samples to them with an efficient Monte Carlo scheme that minimizes our description length objective. For temporally ordered networks, we use a polynomial time dynamic programming approach that restricts the clusters of network layers to be temporally contiguous. These methods recover planted heterogeneity in synthetic network populations and identify essential structural heterogeneities in global trade and fossil record networks. Our methods are principled, scalable, parameter-free, and accommodate a wide range of data, providing a unified lens for exploratory analyses and preprocessing large sets of network samples.

2022

Cross-validation of correlation networks using modular structure

Magnus Neuman, Viktor Jonsson, Joaquín Calatayud, Martin Rosvall

Applied Network Science 7, 75 (2022) [pdf] [arXiv:2303.01835]

We propose a module-based cross-validation approach for thresholding correlation networks derived from multivariate data. By integrating modular structure into the sparsification process, the method addresses the challenge of balancing overfitting and underfitting. Tests on synthetic and real datasets show that its ability to recover a planted partition has a step-like dependence on the number of data samples, with diminishing gains beyond a critical threshold. Compared to the established WGCNA method, the approach reveals greater modular structure in the tested datasets.

Mapping nonlocal relationships between metadata and network structure with metadata-dependent encoding of random walks

Aleix Bassolas, Anton Holmgren, Antoine Marot, Martin Rosvall, Vincenzo Nicosia

Sci. Adv. 8, 43 (2022) [pdf] [arXiv:2111.05158]

Integrating structural information and metadata, such as gender, social status, or interests, enriches networks and enables a better understanding of the large-scale structure of complex systems. However, existing metadata integration approaches consider only immediately adjacent nodes, thus failing to identify and exploit non-local relations between metadata and network structure, typical of many spatial and social systems. We show how a flow-based community-detection approach can integrate network information and distant metadata, revealing more complex relations. We analyze social and spatial networks using the map equation framework and find that our methodology can detect functional metadata-informed communities in diverse real-world systems. For example, in a mobility network of London, we identify communities that reflect the income distribution, and in a European power-grid network, we identify communities that capture relations between geography and energy prices beyond country borders.

FIG. Lazy encoding random walks on a schematic network with metadata. In this case, the random walk always encodes the next step if the target node's metadata is the same as the current node. When the metadata differs, the walker encodes with probability p in [1/3, 1] in a, p in [1/10, 1/3) in b, and p < 1/10 in c. Node shapes represent metadata, and node colors represent optimal partitions. Random walks with labeled circles where they encode and dashed lines where they do not, colored by the currently encoded module.

Similarity-based Link Prediction from Modular Compression of Network Flows

Christopher Blöcker, Jelena Smiljanić, Ingo Scholtes, Martin Rosvall

Proceedings of Machine Learning Research, PMLR 198:52:1-52:18 (2022) [pdf] [arXiv:2208.14220] [Proceedings of Machine Learning Research, PMLR 198:52:1-52:18 (2022)][OpenReview]

Node similarity scores are a foundation for machine learning in graphs for clustering, node classification, anomaly detection, and link prediction with applications in biological systems, information networks, and recommender systems. Recent works on link prediction use vector space embeddings to calculate node similarities in undirected networks with good performance. Still, they have several disadvantages: limited interpretability, need for hyperparameter tuning, manual model fitting through dimensionality reduction, and poor performance from symmetric similarities in directed link prediction. We propose MapSim, an information-theoretic measure to assess node similarities based on modular compression of network flows. Unlike vector space embeddings, MapSim represents nodes in a discrete, non-metric space of communities and yields asymmetric similarities in an unsupervised fashion. We compare MapSim on a link prediction task to popular embedding-based algorithms across 47 networks and find that MapSim’s average performance across all networks is more than 7% higher than its closest competitor, outperforming all embedding methods in 11 of the 47 networks. Our method demonstrates the potential of compression-based approaches in graph representation learning, with promising applications in other graph learning tasks.

FIG. Map equation coding principles. Left: An example network with nine nodes, ten links, and two communities, A and B, indicated by colours. Each random-walker step is encoded by one codeword for intra-module transitions, or three codewords for inter-module transitions. Codewords are shown next to nodes in colours, their length in bits in the information-theoretic limit in black. Module entry and exit codewords are shown to the left and right of the coloured arrows, respectively. The black trace shows a possible section of a random walk with its encoding and theoretical length at the bottom. Right: The corresponding coding tree. Links are annotated with transition rates to calculate similarities in the information-theoretic limit. Each coding tree path corresponds to a network link, which may or may not exist. The coder remembers the random walker's module but not the most recently visited node. Describing the intra-module transition from node 5 to 3 requires -log2(3/12) = 2 bits. The inter-module transition from node 5 to 7 requires three steps and -log2(1/12 · 1/2 · 2/10) ≈ 6.9 bits.

Map Equation Centrality: A Community-Aware Centrality Score Based on the Map Equation

Christopher Blöcker, Juan Carlos Nieves, Martin Rosvall

Appl Netw Sci 7, 56 (2022) [pdf] [arXiv:2201.12590]

To measure node importance, network scientists employ centrality scores that typically take a microscopic or macroscopic perspective, relying on node features or global network structure. However, traditional centrality measures such as degree centrality, betweenness centrality, or PageRank neglect the community structure found in real-world networks. To study node importance based on network flows from a mesoscopic perspective, we analytically derive a community-aware information-theoretic centrality score based on network flow and the coding principles behind the map equation: map equation centrality. Map equation centrality measures how much further we can compress the network’s modular description by not coding for random walker transitions to the respective node, using an adapted coding scheme and determining node importance from a network flow-based point of view. The information-theoretic centrality measure can be determined from a node’s local network context alone because changes to the coding scheme only affect other nodes in the same module. Map equation centrality is agnostic to the chosen network flow model and allows researchers to select the model that best reflects the dynamics of the process under study. Applied to synthetic networks, we highlight how our approach enables a more fine-grained differentiation between nodes than node-local or network-global measures. Predicting influential nodes for two different dynamical processes on real-world networks with traditional and other community-aware centrality measures, we find that activating nodes based on map equation centrality scores tends to create the largest cascades in a linear threshold model.

FIG. Two options for describing a random walk when a node is silenced, with the silenced node shown as a ring. (a) Using the same code as before: when the random walker visits the silenced node, the sender does not use the corresponding node-visit codeword. (b) Designing a new code: the silenced node does not receive a codeword and visits to that node cannot be encoded. However, the sender communicates module entries through the silenced node.

2021

Flow-based community detection in hypergraphs

Anton Eriksson, Timoteo Carletti, Renaud Lambiotte, Alexis Rojas, and Martin Rosvall

arXiv:2105.04389 [pdf] [arXiv:2105.04389]

To connect structure, dynamics and function in systems with multibody interactions, network scientists model random walks on hypergraphs and identify communities that confine the walks for a long time. The two flow-based community-detection methods Markov stability and the map equation identify such communities based on different principles and search algorithms. But how similar are the resulting communities? We explain both methods’ machinery applied to hypergraphs and compare them on synthetic and real-world hypergraphs using various hyperedge-size biased random walks and time scales. We find that the map equation is more sensitive to time-scale changes and that Markov stability is more sensitive to hyperedge-size biases.

FIG. Phase diagram of solution landscapes for the map equation and Markov stability. Optimal solutions of the schematic hypergraph in Fig. 1 for different hyperedge biases and Markov times. Solutions from Fig. 1(b-d) and the singleton solution with six communities. Light dashed line for the map equation applied to a continuous-time process.

How choosing random-walk model and network representation matters for flow-based community detection in hypergraphs

Anton Eriksson, Daniel Edler, Alexis Rojas, Manlio de Domenico, and Martin Rosvall

Comm. Phys. 4, 133 (2021) [pdf] [arXiv:2101.00656]

Hypergraphs offer an explicit formalism to describe multibody interactions in complex systems. To connect dynamics and function in systems with these higher-order interactions, network scientists have generalised random-walk models to hypergraphs and studied the multibody effects on flow-based centrality measures. But mapping the large-scale structure of those flows requires effective community detection methods. We derive unipartite, bipartite, and multilayer network representations of hypergraph flows and explore how they and the underlying random-walk model change the number, size, depth, and overlap of identified multilevel communities. These results help researchers choose the appropriate modelling approach when mapping flows on hypergraphs.

FIG. A schematic hypergraph represented with three types of networks. (a) The schematic hypergraph with weighted hyperedges and hyperedge-dependent node weights. Thin borders for weight 1 and thick borders for weight 3. A lazy random walk on the schematic hypergraph represented on: (b) a bipartite network, (c) a unipartite network, and (d) a multilevel network. The colours indicate optimised module assignments, in (d) for hyperedge-similarity walks.

Identifying flow modules in ecological networks using Infomap

Carmel Farage, Daniel Edler, Anna Eklöf, Martin Rosvall, and Shai Pilosof

Methods Ecol Evol. 2021;12:778-786 [pdf] [bioRxiv:2020.04.14]

Analysing how species interact in modules is a fundamental problem in network ecology. Theory shows that a modular network structure can reveal underlying dynamic ecological and evolutionary processes, influence dynamics that operate on the network and affect the stability of the ecological system. Although many ecological networks describe flows, such as biomass flows in food webs or disease transmission, most modularity analyses have ignored network flows, which can hinder our understanding of the interplay between structure and dynamics. Here we present Infomap, an established method based on network flows to the field of ecological networks. Infomap is a flexible tool that can identify modules in virtually any type of ecological network and is particularly useful for directed, weighted and multilayer networks. We illustrate how Infomap works on all these network types. We also provide a fully documented repository with additional ecological examples. Finally, to help researchers to analyse their networks with Infomap, we introduce the open-source R package infomapecology. Analysing flow-based modularity is useful across ecology and transcends to other biological and non-biological disciplines. A dynamic approach for detecting modu- lar structure has strong potential to provide new insights into the organisation of ecological networks.

FIG. 5 Structure as a function of increasing global relax rate. (a) Variation in the number of modules. (b) Distribution of module persistence (i.e. the number of layers throughout which a module exists). Boxplots represent the range, 95% quantiles and median (black line). The average is marked with red points and line. As expected, module persistence increases with increasing relax rate. (c) Species flexibility: The bars depict the percentage of species appearing in different numbers of modules.

Mapping flows on weighted and directed networks with incomplete observations

Jelena Smiljanić, Christopher Blöcker, Daniel Edler, Martin Rosvall

J. Comp. Net. 9, 6 (2021) [pdf] [arXiv:2106.14798]

Detecting significant community structure in networks with incomplete observations is challenging because the evidence for specific solutions fades away with missing data. For example, recent research shows that flow-based community detection methods can highlight spurious communities in sparse undirected and unweighted networks with missing links. Current Bayesian approaches developed to overcome this problem do not work for incomplete observations in weighted and directed networks that describe network flows. To overcome this gap, we extend the idea behind the Bayesian estimate of the map equation for unweighted and undirected networks to enable more robust community detection in weighted and directed networks. We derive an empirical Bayes estimate of the transitions rates that can incorporate metadata information and show how an efficient implementation in the community-detection method Infomap provides more reliable communities even with a significant fraction of data missing.

FIG. A schematic weighted network with complete and missing link observations. (a) A complete network with accurate network flows and inferred communities. (b) Missing link observations introduce inaccuracies. (c) A standard teleportation scheme cannot overcome the inaccuracies. (d) Regularized network flows with an empirical Bayes estimate of the transition rates using the relaxed continuous configuration model recovers the complete network’s community structure. Light background areas indicate optimal community assignments. The width of the light blue lines represents teleportation weight. The size of the light blue node centres indicates teleportation probability. The dashed black lines show sample trajectories of random walks. We omit link directions in this example for simplicity.

2020

Mapping flows on bipartite networks

Christopher Blöcker, Martin Rosvall

Phys. Rev. E 102, 052305 (2020) [pdf] [arXiv:2007.01666]

Mapping network flows provides insight into the organization of networks, but even though many real-networks are bipartite, no method for mapping flows takes advantage of the bipartite structure. What do we miss by discarding this information and how can we use it to understand the structure of bipartite networks better? The map equation models network flows with a random walk and exploits the information-theoretic duality between compression and finding regularities to detect communities in networks. However, it does not use the fact that random walks in bipartite networks alternate between node types, information worth 1 bit. To make some or all of this information available to the map equation, we developed a coding scheme that remembers node types at different rates. We explored the community landscape of bipartite real-world networks from no node-type information to full node-type information and found that using node types at a higher rate generally leads to deeper community hierarchies and a higher resolution. The corresponding compression of network flows exceeds the amount of extra information provided. Consequently, taking advantage of the bipartite structure increases the resolution and reveals more network regularities.

FIG. Graphical representation of the code books for the standard map equation and the bipartite map equation with α=0.1 in an unweighted example network where colors indicate modules. Block width corresponds to code word usage rate and block height to code-book entropy, a block's contribution to the map equation is its area. Letters in the blocks indicate which nodes they refer to, and e stands for module exits. The horizontal gray bars show the contributions at index and module level. (a) The example network with color-coded modules. (b) The standard map equation calculates the code length as 2.61 bits. (c) Using node-type information worth I = 0.47 bits, the bipartite map equation with mixed node-type memory improves the compression by 0.65 bits to 1.96 bits.

Mapping flows on sparse networks with missing links

Jelena Smiljanić, Daniel Edler, and Martin Rosvall

Phys. Rev. E 102, 012302 (2020) [pdf] [arXiv:1912.05377]

Unreliable network data can cause community-detection methods to overfit and highlight spurious structures with misleading information about the organization and function of complex systems. Here we show how to detect significant flow-based communities in sparse networks with missing links using the map equation. Since the map equation builds on Shannon entropy estimation, it assumes complete data such that analyzing undersampled networks can lead to overfitting. To overcome this problem, we incorporate a Bayesian approach with assumptions about network uncertainties into the map equation framework. Results in both synthetic and real-world networks show that the Bayesian estimate of the map equation provides a principled approach to revealing significant structures in undersampled networks.

FIG. Alluvial diagrams of the Jazz collaboration network show changes in community structure with missing links. (a) The standard map equation and (b) the Bayesian estimate of the map equation with prior ln(V). Compared to the standard map equation, the communities detected using the Bayesian estimate of the map equation are more robust to missing links.

2019

Exploring the solution landscape enables more reliable network community detection

Joaquín Calatayud, Rubén Bernardo-Madrid, Magnus Neuman, Alexis Rojas, and Martin Rosvall

Phys. Rev. E 100, 052308 (2019) [pdf] [arXiv:1905.11230]

To understand how a complex system is organized and functions, researchers often identify communities in the system’s network of interactions. Because it is practically impossible to explore all solutions to guarantee the best one, many community-detection algorithms rely on multiple stochastic searches. But for a given combination of network and stochastic algorithm, how many searches are sufficient to find a solution that is good enough? The standard approach is to pick a reasonably large number of searches and select the network partition with the highest quality or derive a consensus solution based on all network partitions. However, if different partitions have similar qualities such that the solution landscape is degenerate, the single best partition may miss relevant information, and a consensus solution may blur complementary communities. Here we address this degeneracy problem with coarse-grained descriptions of the solution landscape. We cluster network partitions based on their similarity and suggest an approach to determine the minimum number of searches required to describe the solution landscape adequately. To make good use of all partitions, we also propose different ways to explore the solution landscape, including a significance clustering procedure. We test these approaches on synthetic and real-world networks, and find that different networks and algorithms require a different number of searches and that exploring the coarse-grained solution landscape can reveal noteworthy complementary solutions and enable more reliable community detection.

FIG. 1 A schematic solution landscape projected into a two-dimensional space with isolines for quality score. White squares and black circles represent two network partition clusters, with partitions distributed based on their partition distances. Large symbols represent cluster centers.

Map equation with metadata: Varying the role of attributes in community detection

Scott Emmons and Peter J. Mucha

Phys. Rev. E 100, 022301 (2019) [pdf] [arXiv:1810.10433]

Much of the community detection literature studies structural communities, communities defined solely by the connectivity patterns of the network. Often networks contain additional metadata which can inform community detection such as the grade and gender of students in a high school social network. In this work, we introduce a tuning parameter to the content map equation that allows users of the Infomap community detection algorithm to control the metadata’s relative importance for identifying network structure. On synthetic networks, we show that our algorithm can overcome the structural detectability limit when the metadata are well aligned with community structure. On real-world networks, we show how our algorithm can achieve greater mutual information with the metadata at a cost in the traditional map equation. Our tuning parameter, like the focusing knob of a microscope, allows users to “zoom in” and “zoom out” on communities with varying levels of focus on the metadata.

FIG. 1 (a,d) Illustrating how our formulation of the content map equation extends the traditional map equation. (a) An example random walk on a weighted, undirected network. The thickness of each edge corresponds to its weight. (d) Introducing four discrete metadata values, depicted by shape, to the nodes of the network. Our extension of the traditional map equation with the content map equation additionally encodes the metadata value at each step of the random walk by introducing metadata codebooks.

2018

Constrained information flows in temporal networks reveal intermittent communities

Ulf Aslak, Martin Rosvall, and Sune Lehmann

Phys. Rev. E 97, 062312 (2018) [pdf] [arXiv:1711.07649]

Many real-world networks are representations of dynamic systems with interactions that change over time, often in uncoordinated ways and at irregular intervals. For example, university students connect in intermittent groups that repeatedly form and dissolve based on multiple factors, including their lectures, interests, and friends. Such dynamic systems can be represented as multilayer networks where each layer represents a snapshot of the temporal network. In this representation, it is crucial that the links between layers accurately capture real dependencies between those layers. Often, however, these dependencies are unknown. Therefore, current methods connect layers based on simplistic assumptions that cannot capture node-level layer dependencies. For example, connecting every node to itself in other layers with the same weight can wipe out essential dependencies between intermittent groups, making it difficult or even impossible to identify them. In this paper, we present a principled approach to estimating node-level layer dependencies based on the network structure within each layer. We implement our node-level coupling method in the community detection framework Infomap and demonstrate its performance compared to current methods on synthetic and real temporal networks. We show that our approach more effectively constrains information inside multilayer communities so that Infomap can better recover planted groups in multilayer benchmark networks that represent multiple modes with different groups and better identify intermittent communities in real temporal contact networks. These results suggest that node-level layer coupling can improve the modeling of information spreading in temporal networks and better capture their dynamic community structure.

FIG. 1 Going beyond standard methods makes it possible to take advantage of richer interaction data. (a) Standard methods shoehorn interaction data about a complex system into an often unweighted and undirected network, which limits what regularities can be detected. (b) Modeling and mapping higher-order network flows can break this detectability limit.

2017

Infomap Bioregions: Interactive mapping of biogeographical regions from species distributions

Daniel Edler, Thaís Guedes, Alexander Zizka, Martin Rosvall, and Alexandre Antonelli

Syst. Biol. 66 (2): 197-204 (2017) [pdf] [arXiv:1512.00892]

Biogeographical regions (bioregions) reveal how different sets of species are spatially grouped and therefore are important units for conservation, historical biogeography, ecol- ogy and evolution. Several methods have been developed to identify bioregions based on species distribution data rather than expert opinion. One approach successfully applies network theory to simplify and highlight the underlying structure in species distributions. However, this method lacks tools for simple and efficient analysis. Here we present In- fomap Bioregions, an interactive web application that inputs species distribution data and generates bioregion maps. Species distributions may be provided as georeferenced point occurrences or range maps, and can be of local, regional or global scale. The application uses a novel adaptive resolution method to make best use of often incomplete species dis- tribution data. The results can be downloaded as vector graphics, shapefiles or in table format. We validate the tool by processing large datasets of publicly available species distribution data of the world’s amphibians using species ranges, and mammals using point occurrences. As examples of applications, researchers can reconstruct ancestral ranges in historical biogeography or identify indicator species for targeted conservation.

FIG. 3 Bioregion map and phylogenetic tree of world mammals with ancestral range reconstruction, generated with Infomap Bioregions. a) Phylogenetic tree of 5,747 mammals computed from (Faurby and Svenning, 2015), fully zoomable on the online application. Ancestral ranges reconstructed under Fitch parsimony. Pie charts depict most parsimonious ancestral ranges at nodes, and current distributions for extant species. Branch lines are scaled to the number of terminals subtending each branch, in order to improve visualisation of the overall tree structure. b) Magnified part of the tree, highlighting the rock-wallabies (genus Petrogale) which are currently distributed across several bioregions in Australia. This analysis suggests that all rock-wallabies, including the Yellow-footed rock-wallaby (Petrogale xanthopus), which is the most indicative species of the southeast bioregion (i), originated from a common ancestor in northern Australia. c) Bioregion map of world mammals using species point occurrences from GBIF. White areas have insufficient data and were excluded from the analysis. Colours are used consistently across the subfigures. Table shows information about labelled bioregions.

Mapping higher-order network flows in memory and multilayer networks with Infomap

Daniel Edler, Ludvig Bohlin, and Martin Rosvall

Algorithms 10, 112 (2017) [pdf] [arXiv:1706.04792]

Comprehending complex systems by simplifying and highlighting important dynamical patterns requires modeling and mapping higher-order network flows. However, complex systems come in many forms and demand a range of representations, including memory and multilayer networks, which in turn call for versatile community-detection algorithms to reveal important modular regularities in the flows. Here we show that various forms of higher-order network flows can be represented in a unified way with networks that distinguish physical nodes for representing a complex system’s objects from state nodes for describing flows between the objects. Moreover, these so-called sparse memory networks allow the information-theoretic community detection method known as the map equation to identify overlapping and nested flow modules in data from a range of different higher-order interactions such as multistep, multi-source, and temporal data. We derive the map equation applied to sparse memory networks and describe its search algorithm Infomap, which can exploit the flexibility of sparse memory networks. Together they provide a general solution to reveal overlapping modular patterns in higher-order flows through complex systems.

FIG. 1 Going beyond standard methods makes it possible to take advantage of richer interaction data. (a) Standard methods shoehorn interaction data about a complex system into an often unweighted and undirected network, which limits what regularities can be detected. (b) Modeling and mapping higher-order network flows can break this detectability limit.

2016

Efficient community detection of network flows for varying Markov times and bipartite networks

Masoumeh Kheirkhahzadeh, Andrea Lancichinetti, and Martin Rosvall

Phys. Rev. E 93, 032309 (2016) [pdf] [arXiv:1511.01540]

Community detection of network flows conventionally assumes one-step dynamics on the links. For sparse networks and interest in large-scale structures, longer timescales may be more appropriate. Oppositely, for large networks and interest in small-scale structures, shorter timescales may be better. However, current methods for analyzing networks at different timescales require expensive and often infeasible network reconstructions. To overcome this problem, we introduce a method that takes advantage of the inner-workings of the map equation and evades the reconstruction step. This makes it possible to efficiently analyze large networks at different Markov times with no extra overhead cost. The method also evades the costly unipartite projection for identifying flow modules in bipartite networks.

FIG. 1 The Markov time sets the scale of the flow modules. A schematic Sierpinski network with hierarchically nested modules, and the code length for different partitions indicated in the network as a function of the Markov time. The partition with the shortest code length for a given Markov time is highlighted.

Maps of sparse Markov chains efficiently reveal community structure in network flows with memory

Christian Persson, Ludvig Bohlin, Daniel Edler, and Martin Rosvall

pdf [pdf] [arXiv:1606.08328]

To better understand the flows of ideas or information through social and biological systems, researchers develop maps that reveal important patterns in network flows. In practice, network flow models have implied memoryless first-order Markov chains, but recently researchers have introduced higher-order Markov chain models with memory to capture patterns in multi-step pathways. Higher-order models are particularly important for effectively revealing actual, overlapping community structure, but higher-order Markov chain models suffer from the curse of dimensionality: their vast parameter spaces require exponentially increasing data to avoid overfitting and therefore make mapping inefficient already for moderate-sized systems. To overcome this problem, we introduce an efficient cross-validated mapping approach based on network flows modeled by sparse Markov chains. To illustrate our approach, we present a map of citation flows in science with research fields that overlap in multidisciplinary journals. Compared with currently used categories in science of science studies, the research fields form better units of analysis because the map more effectively captures how ideas flow through science.

FIG. 5 Map of citation flows in science modeled by a sparse Markov chain model. The map highlights the most influential research fields in each research area (green circles), citation flows between fields (blue arrows), and how PNAS is represented in multiple research fields (red circles). Orange circles indicate where citation flows through PNAS represented in microbiology and plant science move next, respectively. Circle sizes are proportional to the citation flows and the inner circles represent module flow persistence. The map builds on a sparse Markov chain model based on citation flows through 4.9 million articles published 2007--2012 in the top 10,000 journals of Web of Science.

2015

Identifying modular flows on multilayer networks reveals highly overlapping organization in interconnected systems

Manlio De Domenico, Andrea Lancichinetti, Alex Arenas, and Martin Rosvall

Phys Rev X 5, 011027 (2015) [pdf] [arXiv:1408.2925]

To comprehend interconnected systems across the social and natural sciences, researchers have developed many powerful methods to identify functional modules. For example, with interaction data aggregated into a single network layer, flow-based methods have proven useful for identifying modular dynamics in weighted and directed networks that capture constraints on flow processes. However, many interconnected systems consist of agents or components that exhibit multiple layers of interactions, possibly from several different processes. Inevitably, representing this intricate network of networks as a single aggregated network leads to information loss and may obscure the actual organization. Here, we propose a method based on a compression of network flows that can identify modular flows both within and across layers in nonaggregated multilayer networks. Our numerical experiments on synthetic multilayer networks, with some layers originating from the same interaction process, show that the analysis fails in aggregated networks or when treating the layers separately, whereas the multilayer method can accurately identify modules across layers that originate from the same interaction process. We capitalize on our findings and reveal the community structure of two multilayer collaboration networks with topics as layers: scientists affiliated with the Pierre Auger Observatory and scientists publishing works on networks on the arXiv. Compared to conventional aggregated methods, the multilayer method uncovers connected topics and reveals smaller modules with more overlap that better capture the actual organization.

FIG. 1 Modular flow on a schematic multilayer network. (a) A schematic multilayer network with physical nodes in three layers. (b) A random walker on the multilayer network moving between the physical nodes in each layer. (c) The three layers represented as a multiplex network with physical nodes in black and state nodes in blue, red, and orange. (d) A random walker on the multiplex network moving between the state nodes. While the random walker moves according to the weights between the state nodes, only the physical nodes are considered to be observables, as illustrated by the sequence of physical nodes that the random walker has visited.

Estimating the resolution limit of the map equation in community detection

Tatsuro Kawamoto and Martin Rosvall

Phys Rev E 91, 012809 (2015) [pdf] [arXiv:1402.4385]

A community detection algorithm is considered to have a resolution limit if the scale of the smallest modules that can be resolved depends on the size of the analyzed subnetwork. The resolution limit is known to prevent some community detection algorithms from accurately identifying the modular structure of a network. In fact, any global objective function for measuring the quality of a two-level assignment of nodes into modules must have some sort of resolution limit or an external resolution parameter. However, it is yet unknown how the resolution limit affects the so-called map equation, which is known to be an efficient objective function for community detection. We derive an analytical estimate and conclude that the resolution limit of the map equation is set by the total number of links between modules instead of the total number of links in the full network as for modularity. This mechanism makes the resolution limit much less restrictive for the map equation than for modularity; in practice, it is orders of magnitudes smaller. Furthermore, we argue that the effect of the resolution limit often results from shoehorning multilevel modular structures into two-level descriptions. As we show, the hierarchical map equation effectively eliminates the resolution limit for networks with nested multilevel modular structures.

FIG. 3 Detected sizes of modules for each Sierpinski triangle of different size l with the two-level method (circular points) and the multilevel method (cross points). For example, the two-level method detects modules of 3 links and 12 links when the hierarchy of the Sierpinski triangle is three. The Sierpinski triangles up to three levels are illustrated at the top.

2014

Memory in network flows and its effects on spreading dynamics and community detection

Martin Rosvall, Alcides V. Esquivel, Andrea Lancichinetti, Jevin D. West, and Renaud Lambiotte

Nature Comm. 5, 4630 (2014) [pdf] [arXiv:1305.4807] [data]

Random walks on networks is the standard tool for modelling spreading processes in social and biological systems. This first-order Markov approach is used in conventional community detection, ranking and spreading analysis, although it ignores a potentially important feature of the dynamics: where flow moves to may depend on where it comes from. Here we analyse pathways from different systems, and although we only observe marginal consequences for disease spreading, we show that ignoring the effects of second-order Markov dynamics has important consequences for community detection, ranking and information spreading. For example, capturing dynamics with a second-order Markov model allows us to reveal actual travel patterns in air traffic and to uncover multidisciplinary journals in scientific communication. These findings were achieved only by using more available data and making no additional assumptions, and therefore suggest that accounting for higher-order memory in network flows can help us better understand how real systems are organized and function.

FIG. 1 First-order Markov dynamics distort real constraints on flow. (a) In a first-order Markov approach, we model passengers’ travel to a city to be proportional to the observed volume of traffic to that city, and irrespective of where the passengers come from. (b) In a second-order Markov model, passengers’ travel to a city is still proportional to the traffic volume, but also dependent on where the passengers come from. In this example, out-and-back traffic to Chicago only dominates overtransfer traffic when second-order Markov dynamics are taken into account. (c,d) Journal citation flow shows the same memory effect. Citation flow from four different journals to PNAS is mostly shown to return to the same journal or continue to a related journal only when second-order Markov dynamics are taken into account. The percentages represent the relative return flow.

2012

Ranking and clustering of nodes in networks with smart teleportation

Renaud Lambiotte and Martin Rosvall

Phys. Rev. E 85, 056107 (2012) [pdf] [arXiv:1112.5252]

Random teleportation is a necessary evil for ranking and clustering directed networks based on random walks. Teleportation enables ergodic solutions, but the solutions must necessarily depend on the exact implementation and parametrization of the teleportation. For example, in the commonly used PageRank algorithm, the teleportation rate must trade off a heavily biased solution with a uniform solution. Here we show that teleportation to links rather than nodes enables a much smoother trade-off and effectively more robust results. We also show that, by not recording the teleportation steps of the random walker, we can further reduce the effect of teleportation with dramatic effects on clustering.

FIG. 1 Common and smart teleportation in networks. (a) Recorded node teleportation is the commonly used tele- portation scheme. Both steps along links and teleportation steps contribute to node visit rates for ranking and transition rates for clustering, and nodes are the targets of teleportation. (b) In recorded link teleportation, all steps contribute and links are the targets of teleportation. (c) In unrecorded node teleportation, only steps along links (solid lines and filled circles) contribute, and not those due to teleportation (dashed line and open circle). (d) In unrecorded link teleportation, only steps along links contribute and links are the targets of teleportation.

2011

Compression of flow can reveal overlapping modular organization in networks

Alcides Viamontes Esquivel and Martin Rosvall

Phys. Rev. X 1, 021025 (2011) [pdf] [arXiv:1105.0812]

To better understand the organization of overlapping modules in large networks with respect to flow, we introduce the map equation for overlapping modules. In this information-theoretic framework, we use the correspondence between compression and regularity detection. The generalized map equation measures how well we can compress a description of flow in the network when we partition it into modules with possible overlaps. When we minimize the generalized map equation over overlapping network partitions, we detect modules that capture flow and determine which nodes at the boundaries between modules should be classified in multiple modules and to what degree. With a novel greedy-search algorithm, we find that some networks, for example, the neural network of the nematode Caenorhabditis elegans, are best described by modules dominated by hard boundaries, but that others, for example, the sparse European-roads network, have an organization of highly overlapping modules.

FIG. 3 The code structure of the map equation (a) without and (b) with overlapping modules. The color of a node in the networks and of the corresponding block in the code structures represents the module assignment, the width of a block represents the node-visit rate, and the height of the blocks represents the average codelength of code words in the codebooks.

Multilevel compression of random walks on networks reveals hierarchical organization in large integrated systems

Martin Rosvall and Carl T. Bergstrom

PLoS ONE 6(4): e18209 (2011) [pdf] [arXiv:1010.0431]

To comprehend the hierarchical organization of large integrated systems, we introduce the hierarchical map equation that reveals multilevel structures in networks. In this information-theoretic approach, we exploit the duality between compression and pattern detection; by compressing a description of a random walker as a proxy for real flow on a network, we find regularities in the network that induce this system-wide flow. Finding the shortest multilevel description of the random walker therefore gives us the best hierarchical clustering of the network — the optimal number of levels and modular partition at each level — with respect to the dynamics on the network. With a novel search algorithm, we extract and illustrate the rich multilevel organization of several large social and biological networks. For example, from the global air traffic network we uncover countries and continents, and from the pattern of scientific communication we reveal more than 100 scientific fields organized in four major disciplines: life sciences, physical sciences, ecology and earth sciences, and social sciences. In general, we find shallow hierarchical structures in globally interconnected systems, such as neural networks, and rich multilevel organizations in systems with highly separated regions, such as road networks.

FIG. 3 A hierarchical map of science. We partitioned 7,940 journals connected by 9.2 million citations (20) into four major disciplines, which we identified as life sciences, physical sciences, ecology and earth sciences, and social sciences. In physical sciences, we followed a second-level split into the areas of mathematics and of physics and chemistry. The size of the modules represents the fraction of time that a random surfer spends following citations in that field, and the arrows indicate flow volume between the fields. For visual simplicity, we exclude fields and arrows with low flow.

2010

Mapping change in large networks

Martin Rosvall and Carl T. Bergstrom

PLoS ONE 5(1): e8694 (2010) [pdf] [arXiv:0812.1242]

Change is the very nature of interaction patterns in biology, technology, economics, and science itself: The interactions within and between organisms change; the air, ground, and sea traffic change; the global financial flow changes; the scientific research front changes. With increasingly available data, networks and clustering tools have become important methods used to comprehend instances of these large-scale structures. But blind to the difference between noise and trends in the data, these tools alone must fail when used to study change. Only if we can assign significance to the partition of single networks can we distinguish structural changes from fluctuations and assess how much confidence we should have in the changes. Here we show that bootstrap resampling accompanied by significance clustering provides a solution to this problem. We use the significance clustering to realize de Solla Price’s vision of mapping the change in science.

FIG. 3 Mapping change in science. This set of scientific fields show the major shifts in the last decade of science. Each significance clustering for the citation networks in years 2001, 2003, 2005, and 2007 occupies a column in the diagram and is horizontally connected to preceding and succeeding significance clusterings by stream fields. Each block in a column represents a field and the height of the block reflects citation flow through the field. The fields are ordered from bottom to top by their size with mutually nonsignificant fields placed together and separated by half the standard spacing. We use a darker color to indicate the significant subset of each cluster. All journals that are clustered in the field of neuroscience in year 2007 are colored to highlight the fusion and formation of neuroscience.

2009

The map equation

Martin Rosvall, Daniel Axelsson and Carl T. Bergstrom

Eur. Phys. J. Special Topics 178, 13 (2009) [pdf] [arXiv:0906.1405]

Many real-world networks are so large that we must simplify their structure before we can extract useful information about the systems they represent. As the tools for doing these simplifications proliferate within the network literature, researchers would benefit from some guidelines about which of the so-called community detection algorithms are most appropriate for the structures they are studying and the questions they are asking. Here we show that different methods highlight different aspects of a network’s structure and that the the sort of information that we seek to extract about the system must guide us in our decision. For example, many community detection algorithms, including the popular modularity maximization approach, infer module assignments from an underlying model of the network formation process. However, we are not always as interested in how a system’s network structure was formed, as we are in how a network’s extant structure influences the system’s behavior. To see how structure influences current behavior, we will recognize that links in a network induce movement across the network and result in system-wide interdependence. In doing so, we explicitly acknowledge that most networks carry flow. To highlight and simplify the network structure with respect to this flow, we use the map equation. We present an intuitive derivation of this flow-based and information-theoretic method and provide an interactive on-line application that anyone can use to explore the mechanics of the map equation. The differences between the map equation and the modularity maximization approach are not merely conceptual. Because the map equation attends to patterns of flow on the network and the modularity maximization approach does not, the two methods can yield dramatically different results for some network structures. To illustrate this and build our understanding of each method, we partition several sample networks. We also describe an algorithm and provide source code to efficiently decompose large weighted and directed networks based on the map equation.

FIG. 1 Detecting regularities in patterns of movement on a network (derived from (14) and also available in a dynamic version (18)). (a) We want to effectively and concisely describe the trace of a random walker on a network. The orange line shows one sample trajectory. For an optimally efficient one-level description, we can use the codewords of the Huffman codebook depicted in (b). The 314 bits shown under the network describes the sample trajectory in (a), starting with 1111100 for the first node on the walk in the upper left corner, 1100 for the second node, etc., and ending with 00011 for the last node on the walk in the lower right corner. (c) A two-level description of the random walk, in which an index codebook is used to switch between module codebooks, yields on average a 32% shorter description for this network. The codes of the index codebook for switching module codebooks and the codes used to indicate an exit from each module are shown to the left and the right of the arrows under the network, respectively. Using this code, we capitalize on structures with long persistence times, and we can use fewer bits than we could do with a one-level description. For the walk in (a), we only need the 243 bits shown under the the network in (c). The first three bits 111 indicate that the walk begins in the red module, the code 0000 specifies the first node on the walk, and so forth. (d) Reporting only the module names, and not the locations within the modules, provides an efficient coarse-graining of the network.

2008

Maps of information flow reveal community structure in complex networks

Martin Rosvall and Carl T. Bergstrom

PNAS 105, 1118 (2008) [pdf] [arXiv:0707.0609]

To comprehend the multipartite organization of large-scale biological and social systems, we introduce a new information-theoretic approach to reveal community structure in weighted and directed networks. The method decomposes a network into modules by optimally compressing a description of information flows on the network. The result is a map that both simplifies and highlights the regularities in the structure and their relationships to each other. We illustrate the method by making a map of scientific communication as captured in the citation patterns of more than 6000 journals. We discover a multicentric organization with fields that vary dramatically in size and degree of integration into the network of science. Along the backbone of the network — which includes physics, chemistry, molecular biology, and medicine — information flows bidirectionally, but the map reveals a directional pattern of citation from the applied fields to the basic sciences.

FIG.3 A map of science based on citation patterns. We partitioned 6,128 journals connected by 6,434,916 citations into 88 modules and 3,024 directed and weighted links. For visual simplicity we show only the links that the random surfer traverses more than 1/5000’th of her time, and we only show the modules that are visited via these links (see supporting online material for the complete list). Because of the automatic ranking of nodes and links by the random surfer (22), we are assured of showing the most important links and nodes. For this particular level of detail we capture 98% of the node weights and 94% of all flow.